1. OpenNMS Dashboard
In Network Operation Centers NOC an overview about issues in the network is important and often described as Dashboards. Large networks have people (Operator) with different responsibilities and the Dashboard should show only information for a given monitoring context. Network or Server operator have a need to customize or filter information on the Dashboard. A Dashboard as an At-a-glance overview is also often used to give an entry point for more detailed diagnosis through the information provided by the monitoring system. The Surveillance View allows to reduce the visible information by selecting rows, columns and cells to quickly limit the amount of information to navigate through.
1.1. Dashboard Components
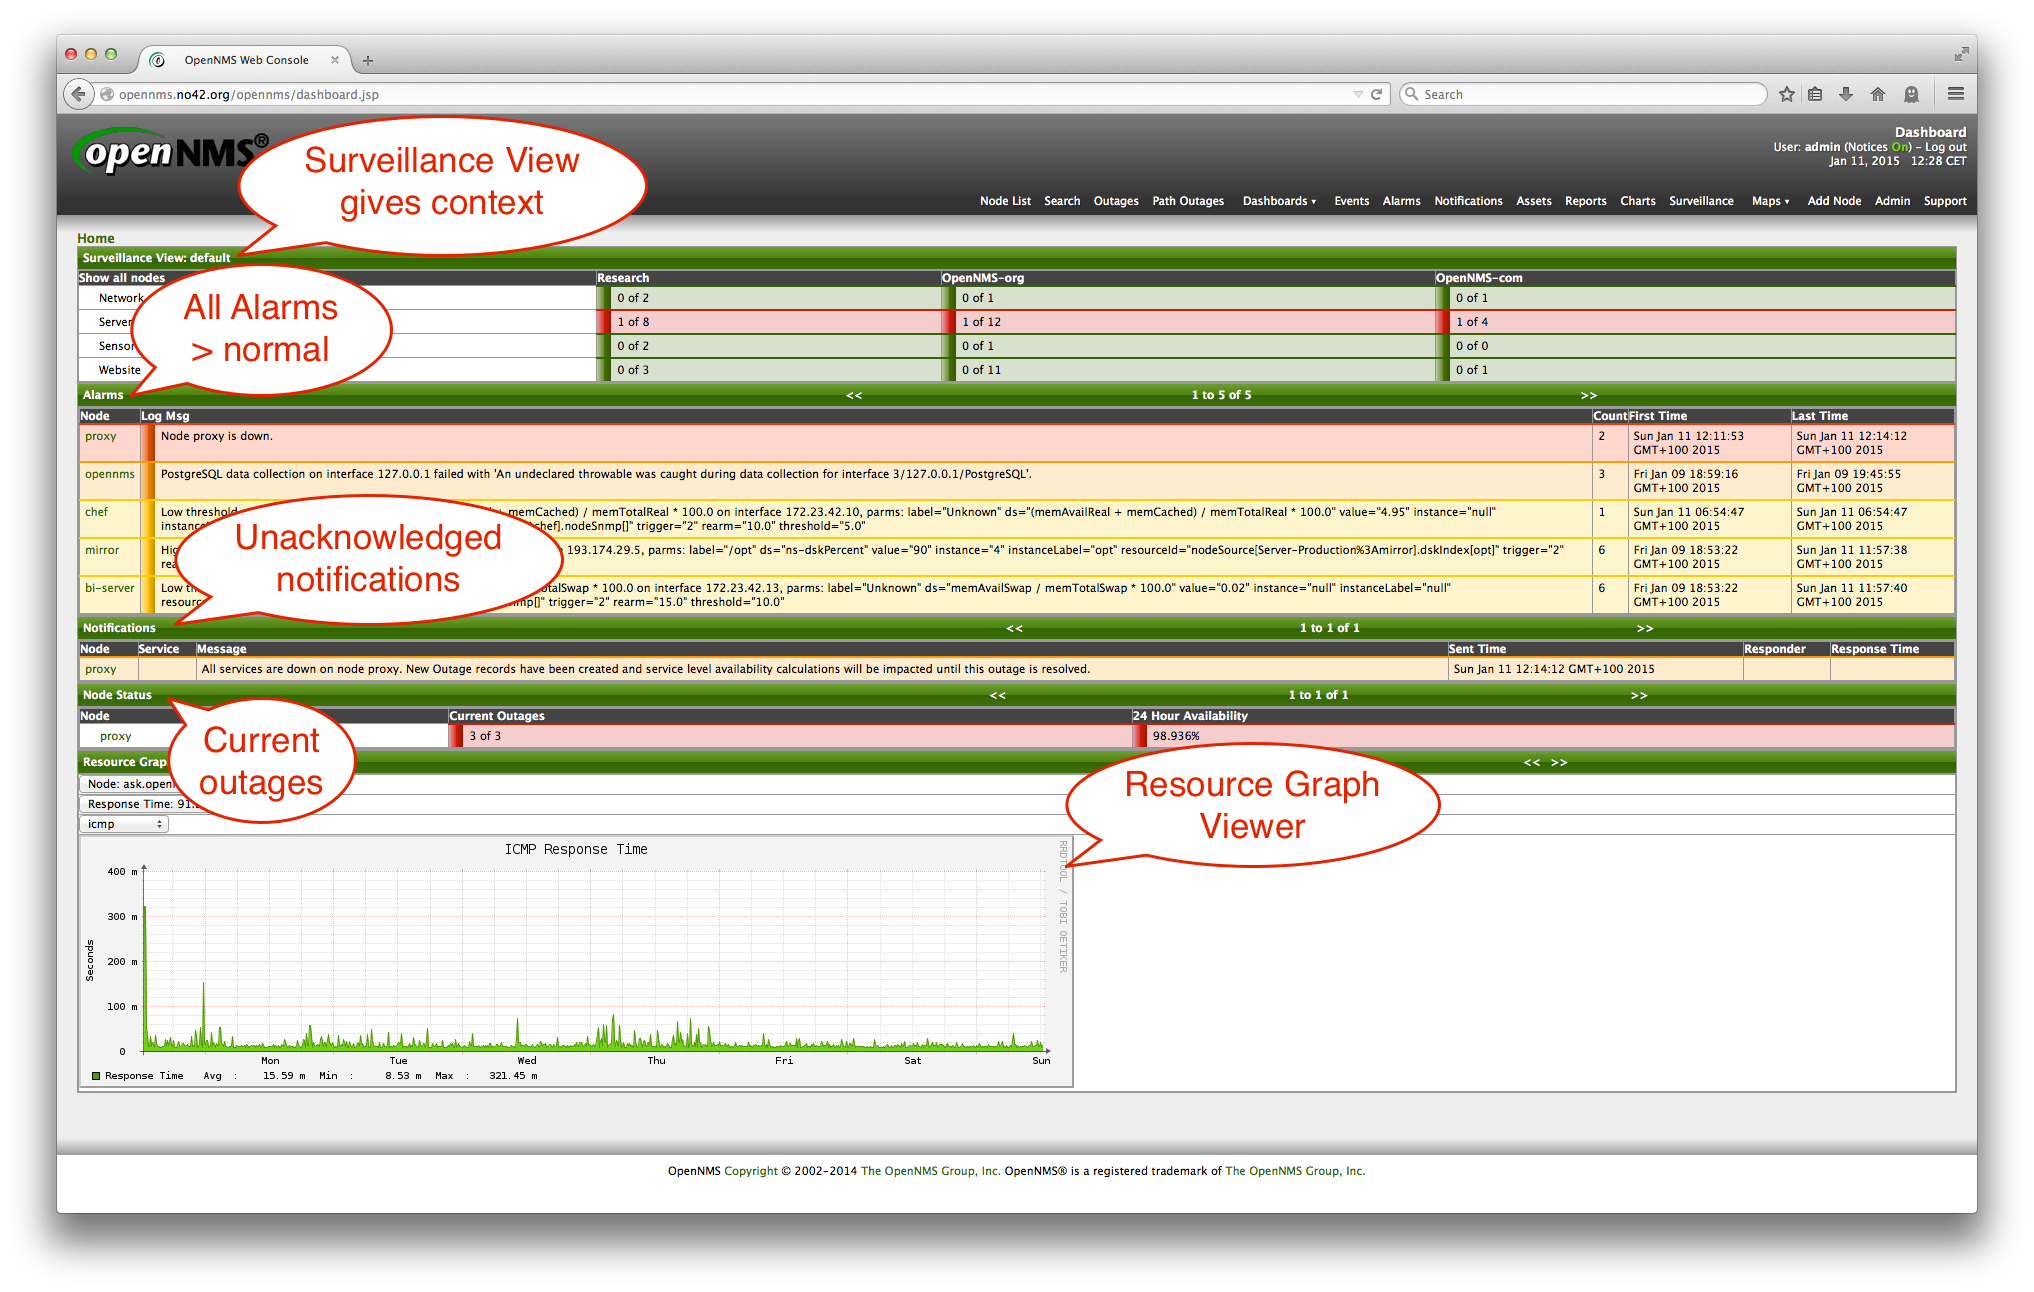
The Dashboard is built with five components:
-
Surveillance View: Allows to model a monitoring context for the Dashboard.
-
Alarms: Shows unacknowledged Alarms which should be escalated by an Operator.
-
Notifications: Shows outstanding and unacknowledged notifications sent to Engineers.
-
Node Status: Shows all ongoing network Outages.
-
Resource Graph Viewer: Shows performance time series reports for performance diagnosis.
The following screenshot shows a configured Dashboard and which information are displayed in the components.
The following section describe the information shown in each component. All other components display information based on the Surveillance View.
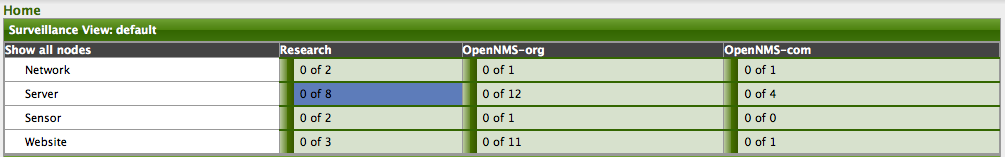
1.1.1. Surveillance View
The Surveillance View has multiple functions.
-
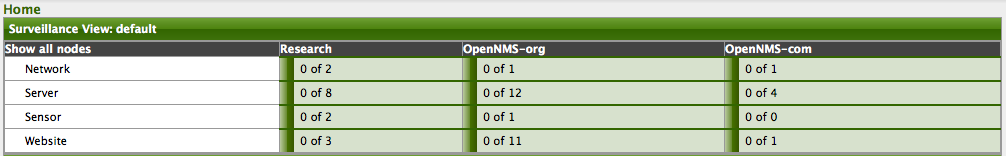
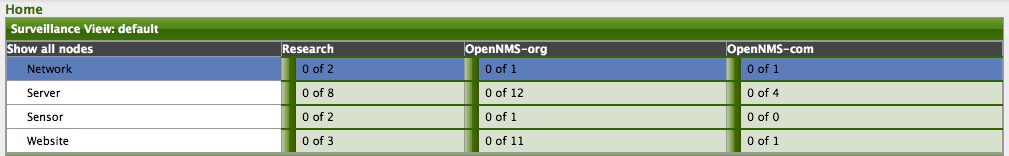
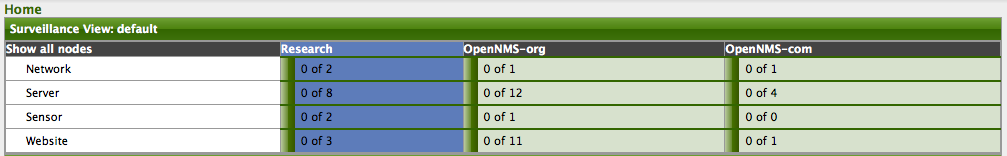
Allows to model the monitoring context and shows service and node Outages in compact matrix view.
-
Allows to limit the number of information in the Dashboard by selecting rows, columns and cells.
The following screenshots show all possible selections in the Surveillance View.
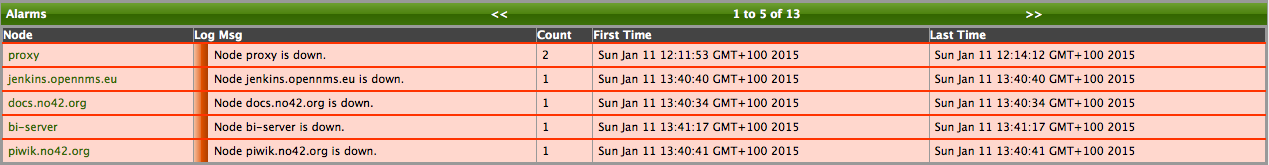
1.1.2. Alarms
The Alarms component gives an overview about all unacknowledged Alarms with a severity higher than Normal(1). Acknowledged Alarms will be removed from the responsibility of the Operator. The following information are shown in:
-
Node: Node label of the node the Alarm is associated.
-
Log Msg: The log message from the Event which is the source for this Alarm. It is specified in the event configuration file in
<logmsg /> -
Count: Number of Alarms deduplicated by the reduction key of the Alarm.
-
First Time: Time for the first occurrence of the Alarm.
-
Last Time: Time for the last occurrence of the Alarm.
The Alarms component shows the 5 latest Alarms and allows with pagination to navigate to older Alarms.
1.1.3. Notifications
To inform people on a duty schedule notifications are used and force action to fix or reconfigure systems immediately. In OpenNMS it is possible to acknowledge notifications to see who is working on a specific issue. The Dashboard should show outstanding notifications in the NOC to provide an overview and give the possibility for intervention.
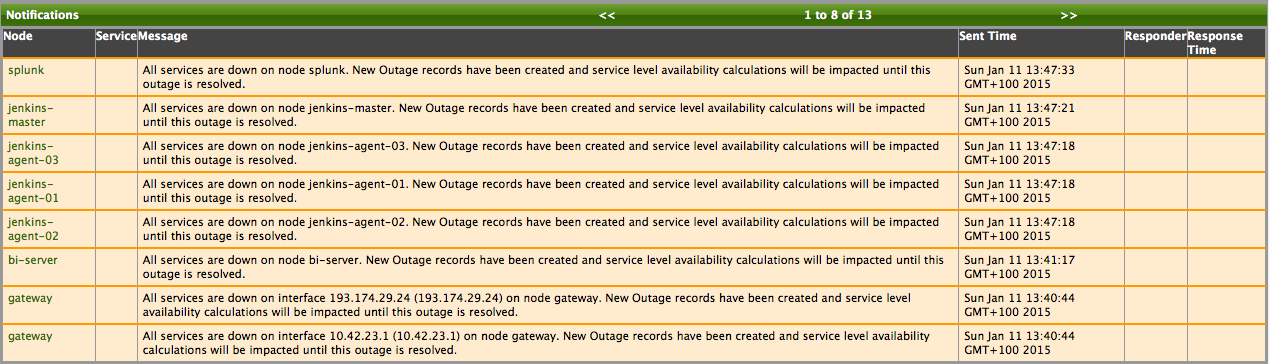
-
Node: Label of the monitored node the notification is associated with.
-
Service: Name of the service the notification is associated with.
-
Message: Message of the notification.
-
Responder: User name who acknowledged the notification
-
Response Time: Time when the user acknowledged the notification
The Notifications component shows the last 8 unacknowledged notifications and allows with pagination to navigate to older unacknowledged notifications.
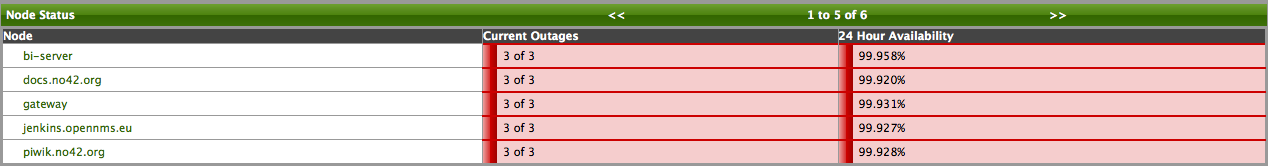
1.1.4. Node Status
An acknowledged Alarm doesn’t mean necessarily the outage is solved. To give an overview information about ongoing Outages in the network, the Dashboard shows an outage list in the Node Status component.
-
Node: Label of the monitored node with ongoing outages.
-
Current Outages: Number of services on the node with outages and total number of monitored services, e.g. with the natural meaning of "3 of 3 services are affected".
-
24 Hour Availability: Availability of all services provided by the node calculated by the last 24 hours.
The Node Status component shows the last 5 ongoing Outages and allows with pagination to navigate to older Outages.
1.1.5. Resource Graph Viewer
To give a quick entry point diagnose performance issues a Resource Graph Viewer allows to navigate to time series data reports which are filtered in the context of the Surveillance View.
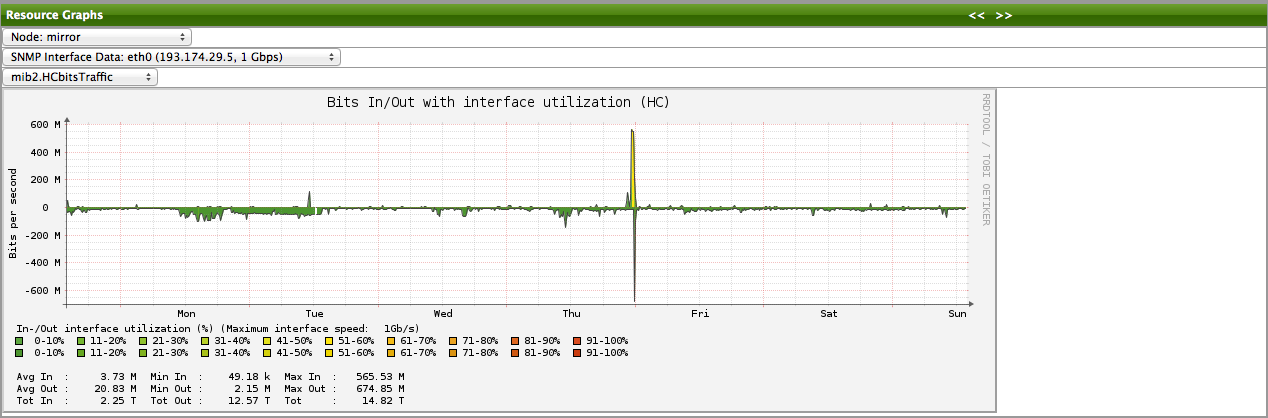
It allows to navigate sequentially through resource graphs provided by nodes filtered by the Surveillance View context and selection and shows one graph report at a time.
1.2. Advanced configuration
The Surveillance View component allows to model multiple views for different monitoring contexts. It gives the possibility to create special view as example for network operators or server operators. The Dashboard shows only one configured Surveillance View. To give different users the possibility using their Surveillance View fitting there requirements it is possible to map a logged in user to a given Surveillance View used in the Dashboard.
The selected nodes from the Surveillance View are also aware of User Restriction Filter. If you have a group of users, which should see just a subset of nodes the Surveillance View will filter nodes which are not related to the assigned user group.